Services
Consultancy Project-Based Approach Support Training Academy
Accelerators
AI Data Analyst Artificial Intelligence CDP as a Service Customer Data Architecture Data Ideation Workshops Data Maturity Assessment Job Analytics Server Side Tracking
Cases
News
Events
About
Our Values Our Team Our Toolkit Careers
Contact Us
  • News
12 January 2017
3 min read

Participation Metrics in Adobe Analytic

Adobe Analytics offers many interesting features, and in my opinion, the participation metric is definitely one of them. In this post I will talk about the benefits, why you should use them, and also teach you to enable them in your analysis workspace

Lara Vandooren
Data Analyst Lead Lara Vandooren

What is a participation metric?

A participation metric is a visit based metric that assigns full credit from success events to all values of a variable.

In simple words, it allows you to determine which pages, campaigns or any other custom variable values are contributing most to your site’s success. It assigns full value to all the touch points that lead to conversion.

Let’s look at an example

The participation metric is often applied to revenue. If we want to know which pages customers visit before buying something, this would be an excellent case.

When you look at revenue, the value is allocated to the different touch points based on the selected allocation model. This can be “first allocation”, “last allocation” or “linear allocation”. If a customer goes from page A to B, then to C and finally buys something for 100$, revenue would be assigned as followed:

Allocation

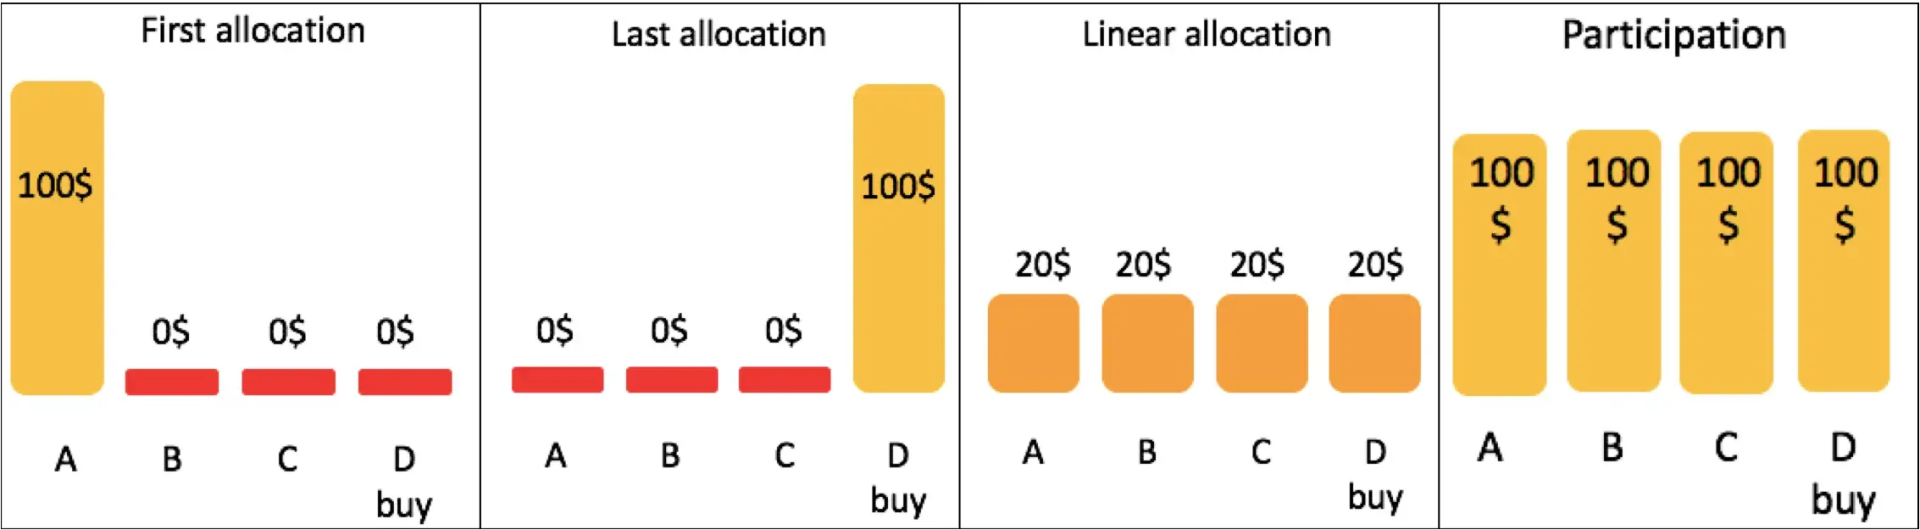
Linear allocation is the most used method. Participation is similar to this, except that full credit is given to all values.

Using this you can say, for example, “out of all purchases, 67% went through the home page”. This also allows you to determine the pages that do not contribute to purchases.

How to enable them in your analysis workspace.

Participation metrics are not available in your analytics workspace by default. Normally they have to be enabled in the admin section, both for specific custom traffic variables or out-of-the-box traffic reports. But there is a way to make participation metrics available in another, easier way:

Step 1: Go to the calculated metric builder

You can find this under “components” > “calculated metrics”. Click on add and create a new metric.

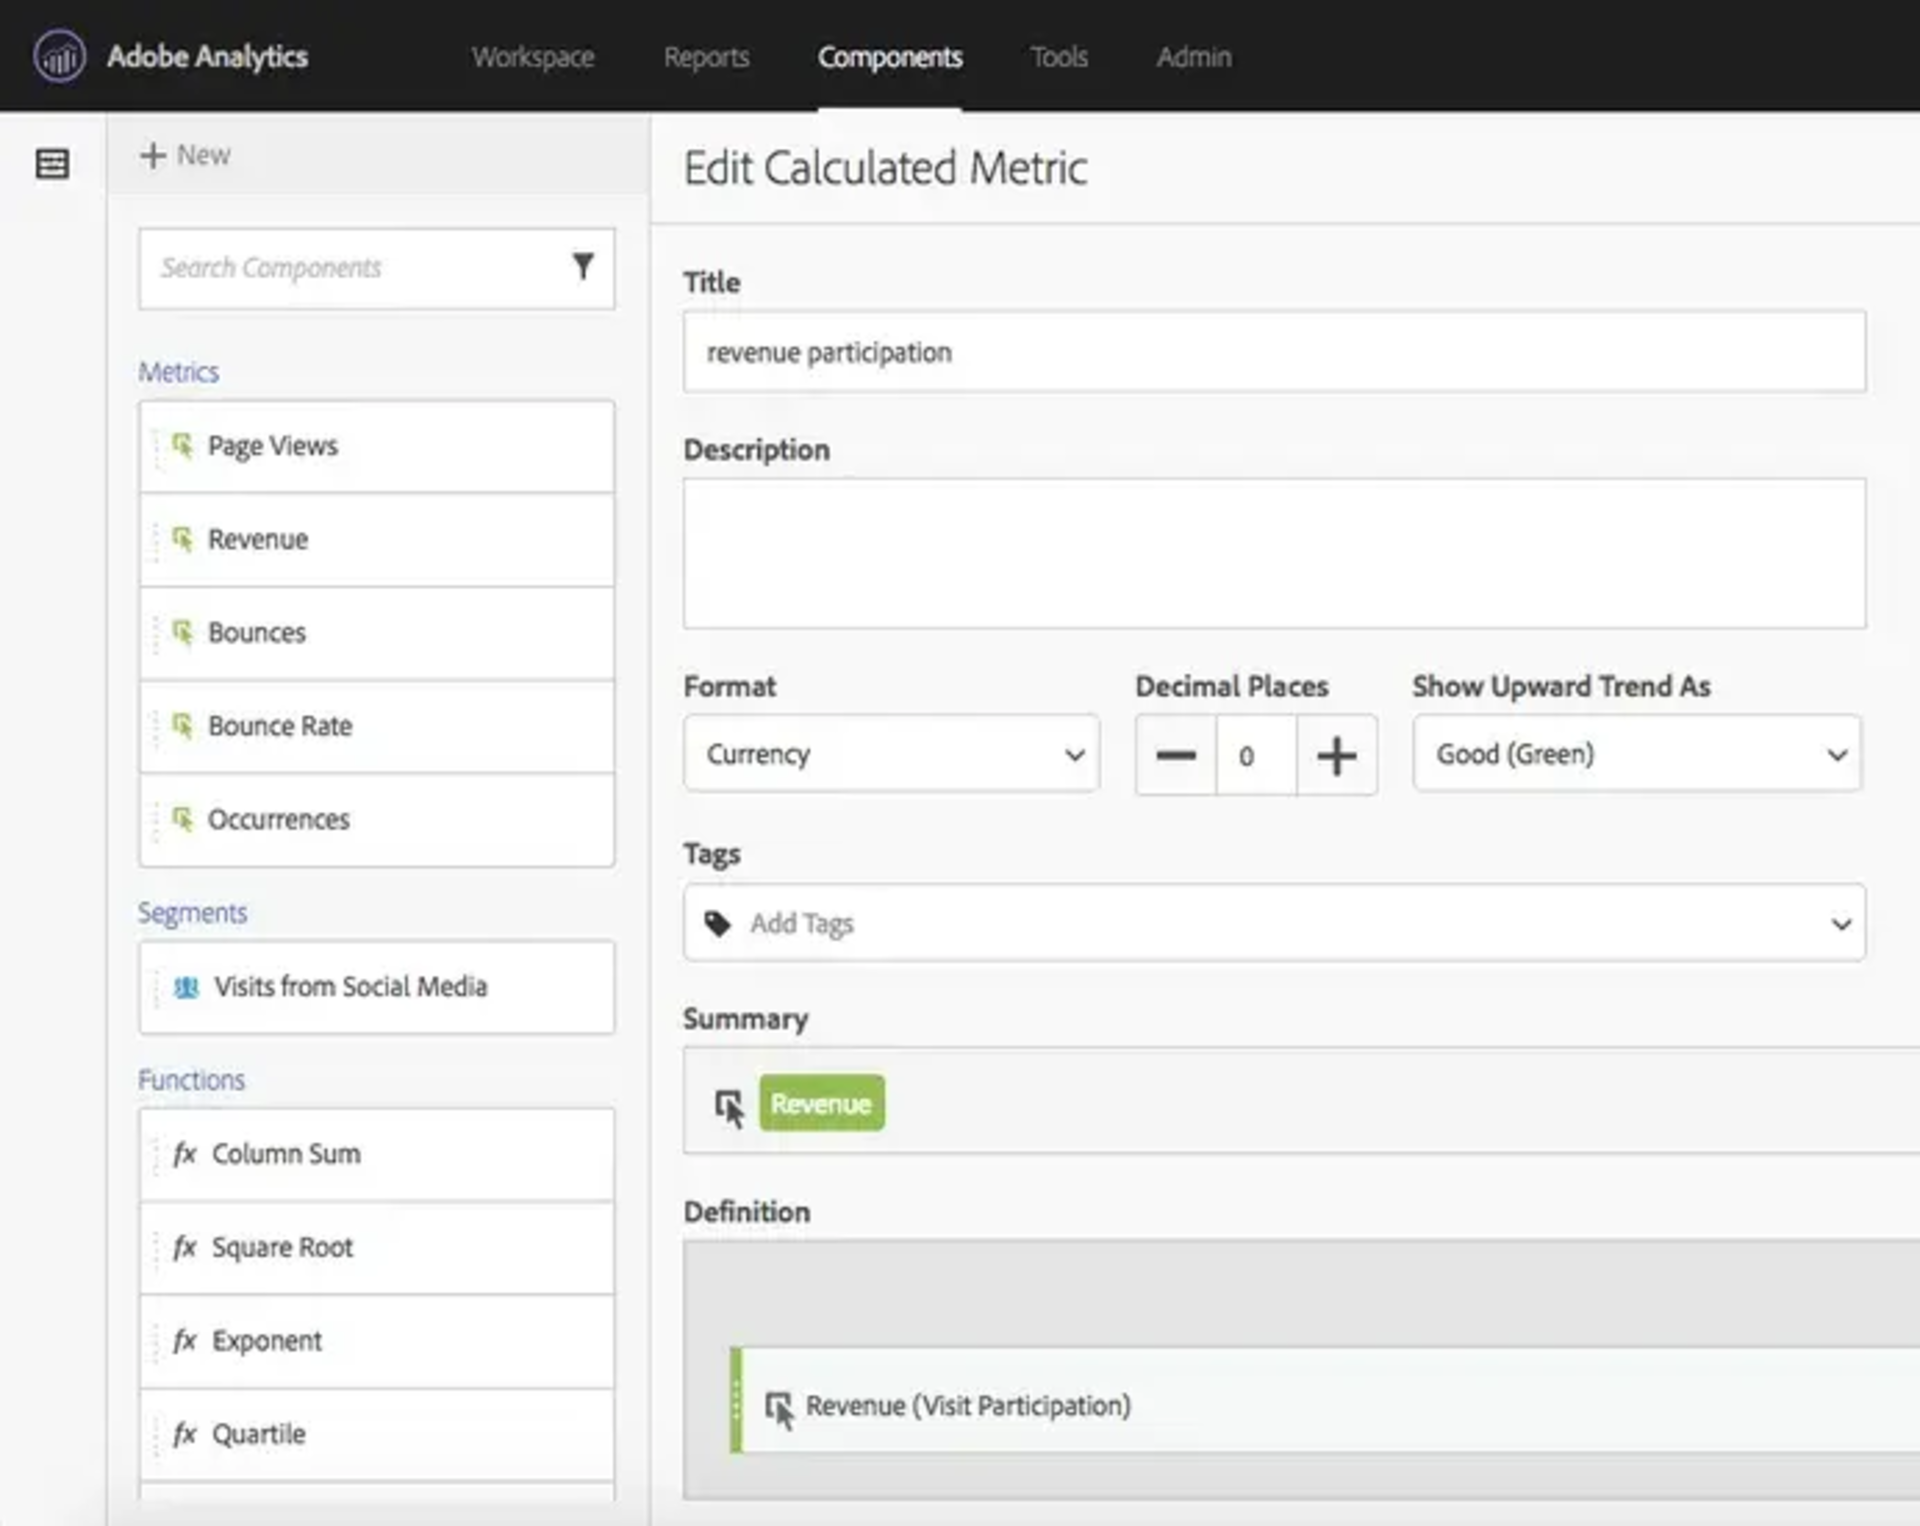
Step 2: Create a metric

Let’s continue with the revenue example. Start by giving it an appropriate title, such as “Revenue participation”. If you want, you can fill in a description as well. In this case, we can change the format to currency, since we are talking about revenue.

Next you just drag and drop the metric “Revenue” from the list on the left to the definition box.

Edit Calculated Metric

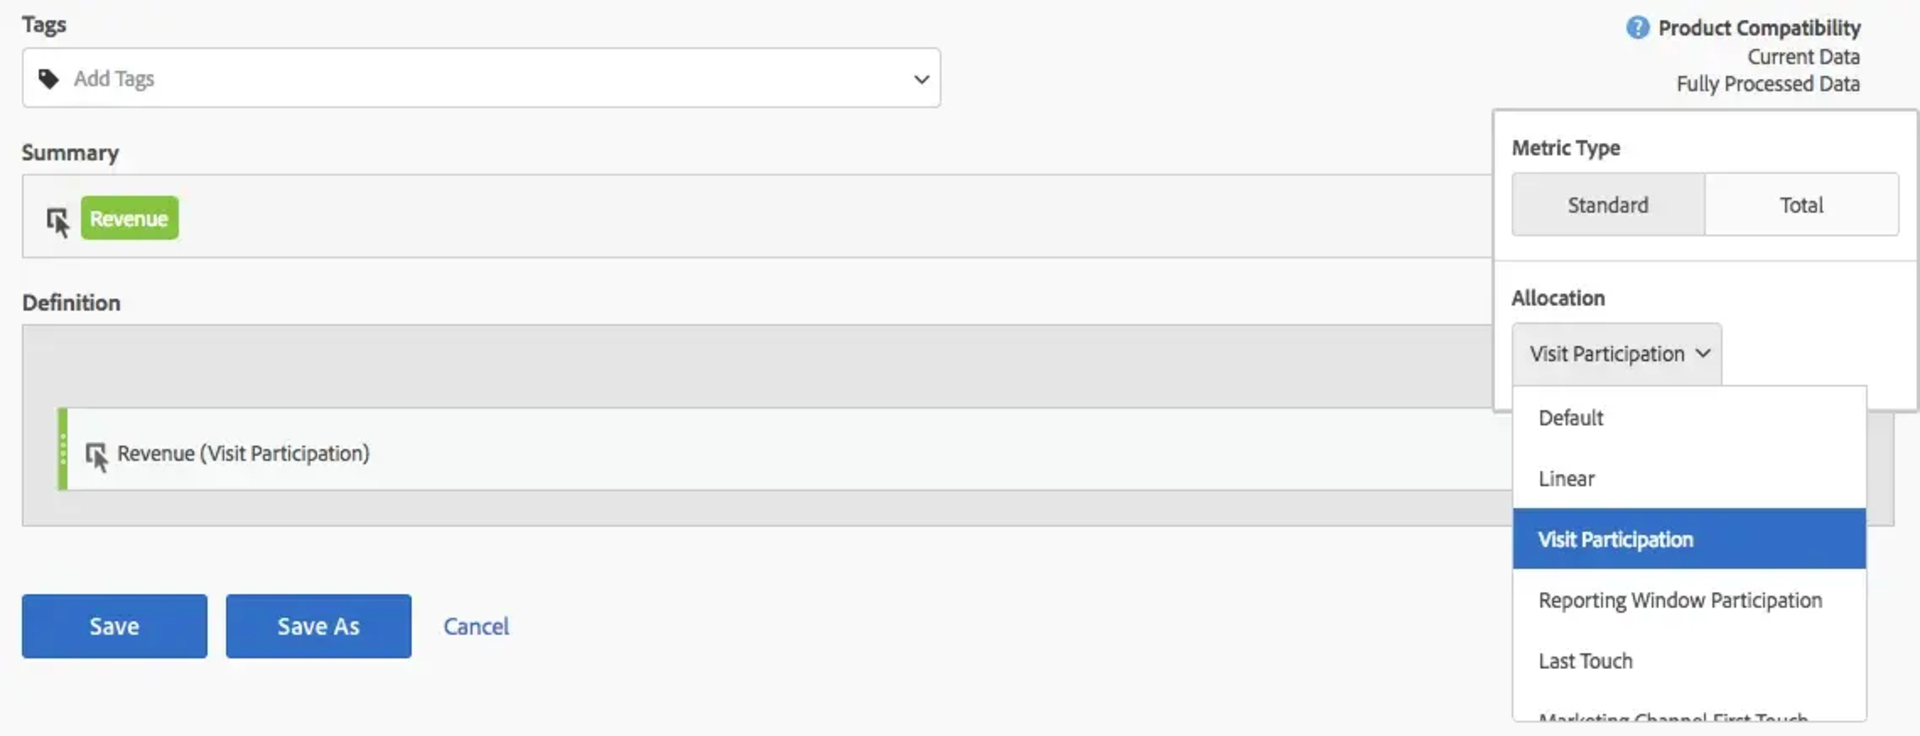
Step 3: set it as a participation metric

This is already the final step. It is that easy! The trick is simple. Next to revenue, in the definition box, you can select the “gear” icon (as indicated below) and select “visit participation”. That’s it, you created your own revenue participation metric.

Participation Metric setup

The same procedure can be followed for any other conversion metric. Now your participation metrics are available everywhere, also in your analytics workspace.

Ready to activate your data?

Ready to embark on a journey of success? Contact us today to discuss your needs. Let's work together to turn your vision into reality.

Reach out, and let's chat.
pencil drawing of two men
  • Contact us
  • Hertshage 10
    9300 Aalst, Belgium
  • welcome@multiminds.eu
  • +32 491 33 11 11
  • Our services
  • Consultancy
  • Project-Based Approach
  • Support
  • Training
  • Our accelerators
  • CDP as a Service
  • Customer Data Architecture
  • Data Ideation Workschops
  • Data Maturity Assessment
  • Server Side Tracking
  • Job Analytics
  • AI Data Analyst
  • Artificial Intelligence
  • Our newsletter
  • Subscribe to our newsletter for the latest news and upcoming workshops.
  • Thank you for subscribing!

©2026 MultiMinds. All rights reserved.

Cookie Policy Privacy Policy

We’re an analytics agency. You know what’s coming.

Honestly? We just want to see how you move through our site so we can make our charts look beautiful and our insights even sharper. It's like a science experiment, and you're our favourite variable.

Necessary cookies help make a website usable by enabling basic functions like page navigation and access to secure areas of the website. The website cannot function properly without these cookies.

anonymous
2 year | HTTP Cookie
Stores the user's cookie consent state for the current domain.
_cfuvid
Session | HTTP Cookie
This cookie is a part of the services provided by Cloudflare - Including load-balancing, deliverance of website content and serving DNS connection for website operators.
_cfuvid
Persistent | HTML Local Storage
This cookie is used to distinguish between humans and bots.

Preference cookies enable a website to remember information that changes the way the website behaves or looks, like your preferred language or the region that you are in.

Analytical cookies help website owners to understand how visitors interact with websites by collecting and reporting information anonymously.

_ga#
1 year | HTTP Cookie
This cookie is a Google Analytics persistent cookie which is used to distinguish unique users.

Marketing cookies are used to track visitors across websites. The intention is to display ads that are relevant and engaging for the individual user and thereby more valuable for publishers and third party advertisers.