How to create a report with automatic rolling date ranges in Adobe Analytics
This is an issue we encountered with one of our clients recently. Monthly dashboards were created in Adobe Analytics to compare some metrics to previous months (“month-over-month”).

Initally, people were copy pasting the same dashboard each and every month, and manually changing the date ranges as well as removing and adding the “compare date range” all over again.
This became a bit of a daunting task, and long story short, it wasn’t maintained. But management still wanted rolling dashboards in Adobe Analytics to compare indicators month-over-month, year-over-year.
The good news is that the entire Adobe Analytics workspace can be set-up with rolling dates, so that each month data from the previous full month is shown; and the date range comparisons are always the month before that.
This may sound a bit confusing, so let’s look at an example.
You can create a monthly dashboard, only showing data if an entire month has past. So, in February, you will see the monthly dashboard of January. When you look at the dashboard on the first of March, you will see data of February.
This is easily done by selecting rolling date ranges in your workspace. In this case, a predefined rolling range exists called “Last month”.
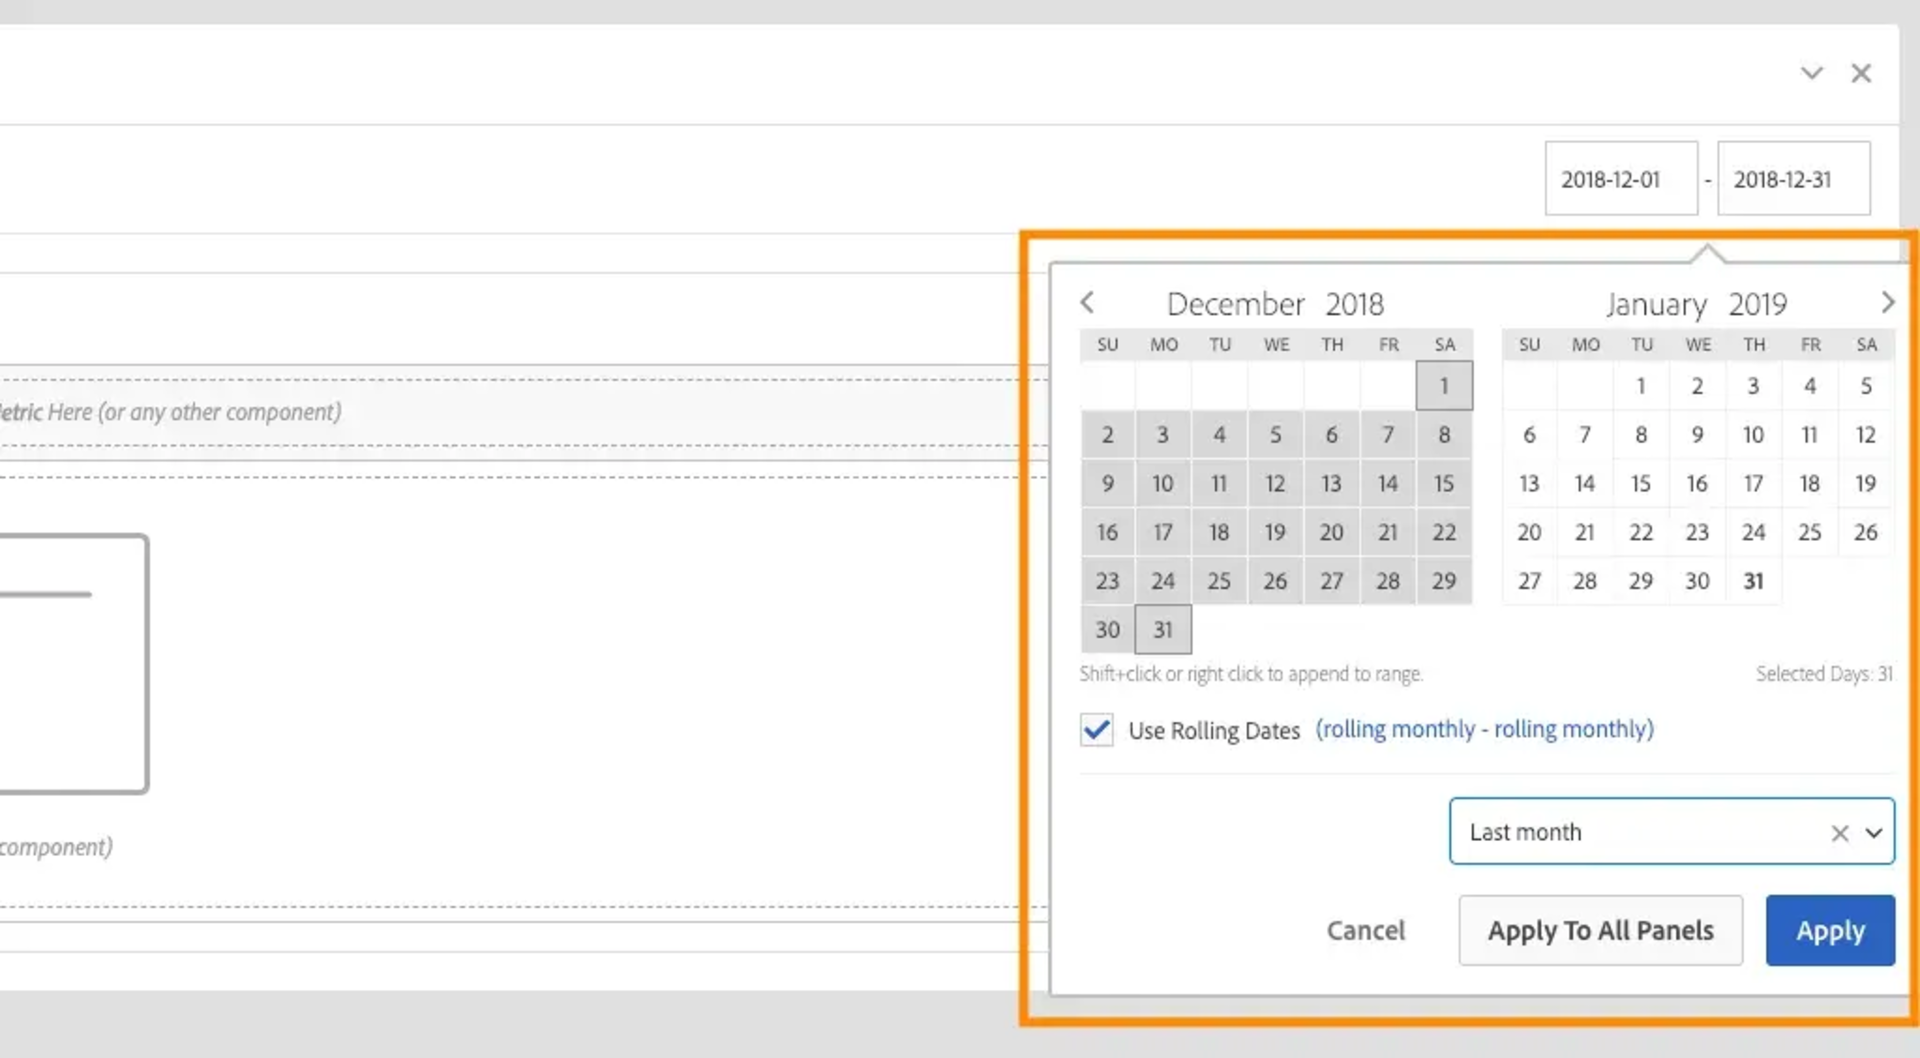
Next, you also need to select a rolling date range when indicating which metric you would like to compare to the month before. Here we will create another rolling date range, but this time we need to create and save this as a custom date range.
Create a custom date range in the date range builder. Since our workspace looks at the last full month, we will want to compare this to the month before (so 2 full months ago). We can create this date range as follows:
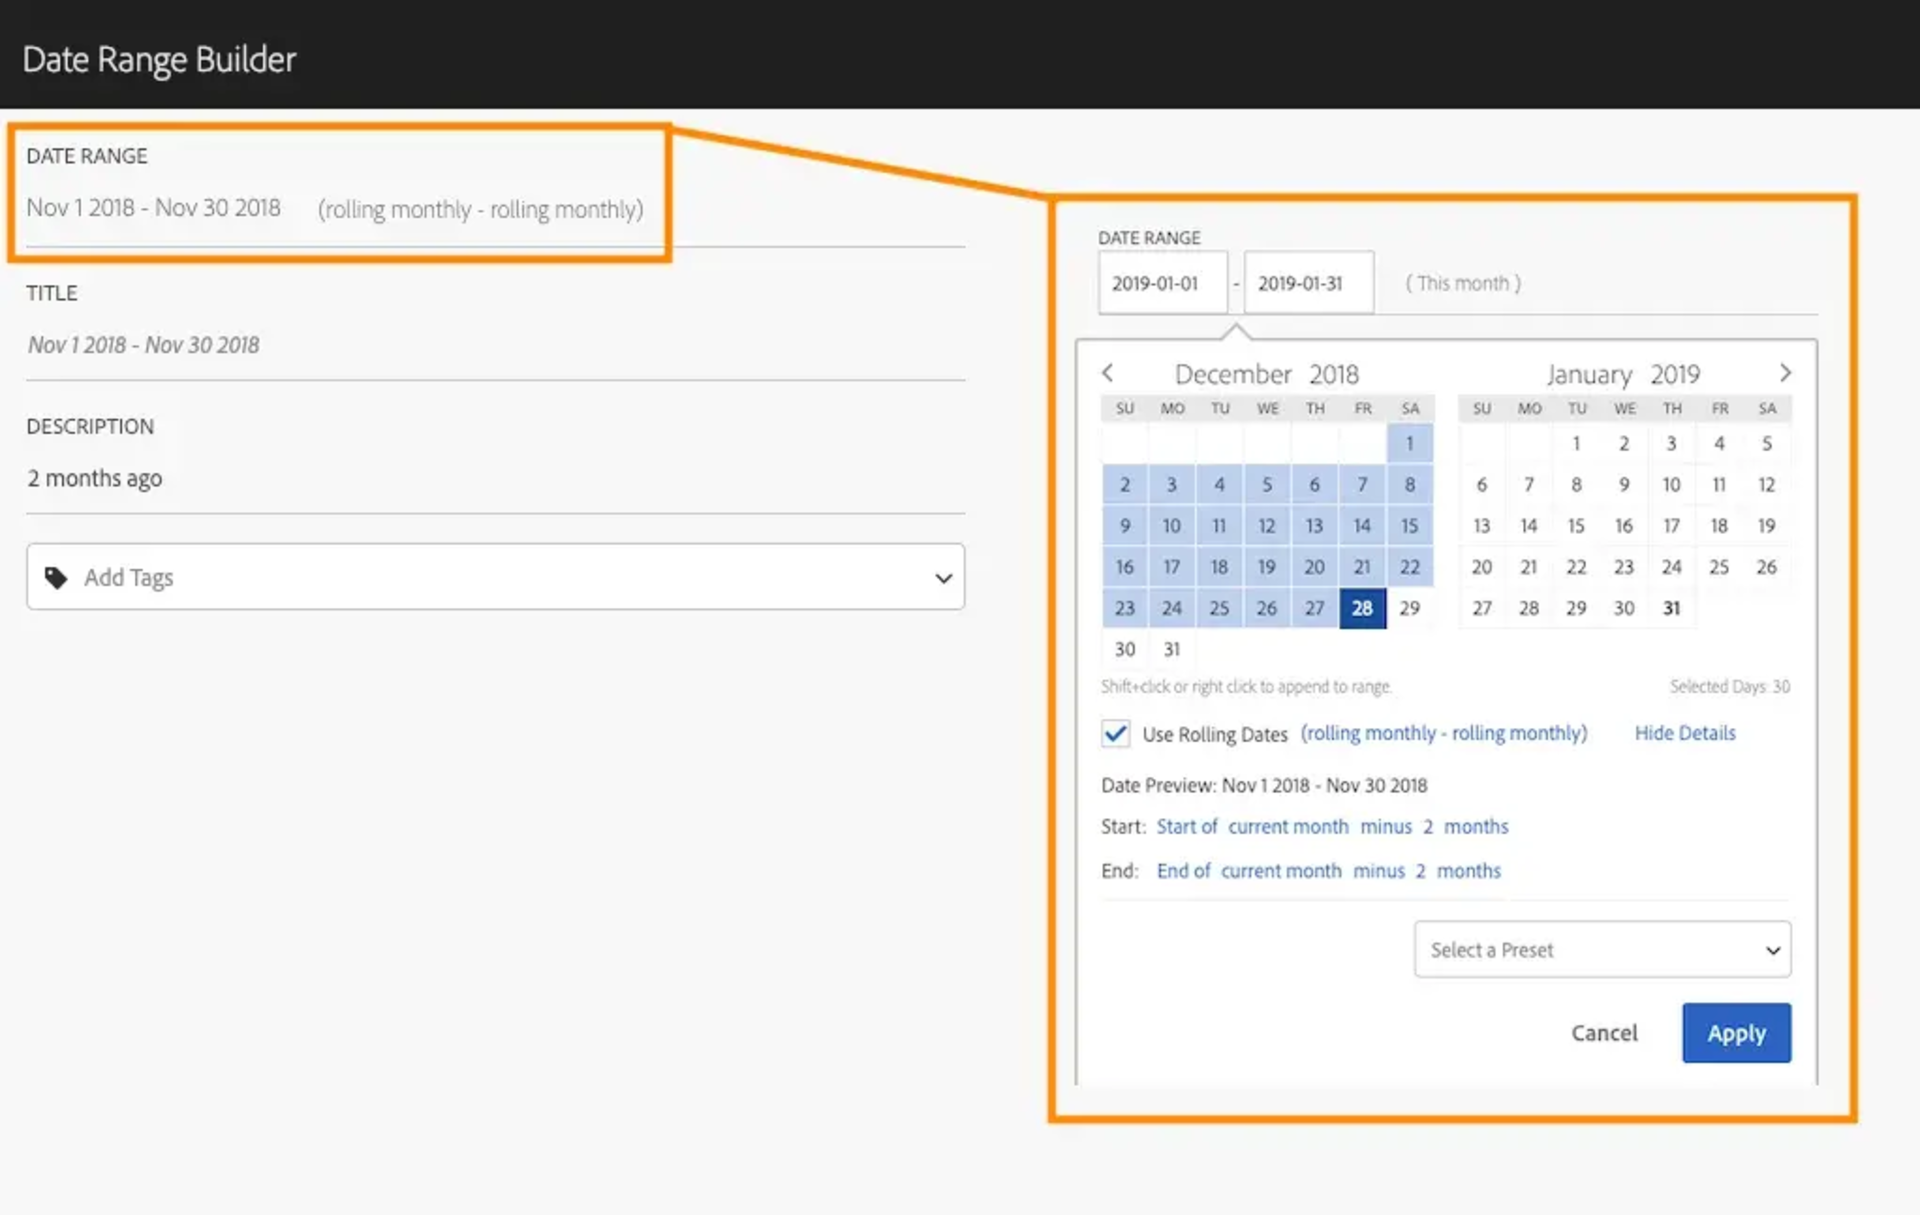
Very important - Save this date range WITHOUT adding a name. If you don't give the date range a custom name, the name will be "Date Preview" as shown above (Nov 1 2018 - Nov 30 2018).
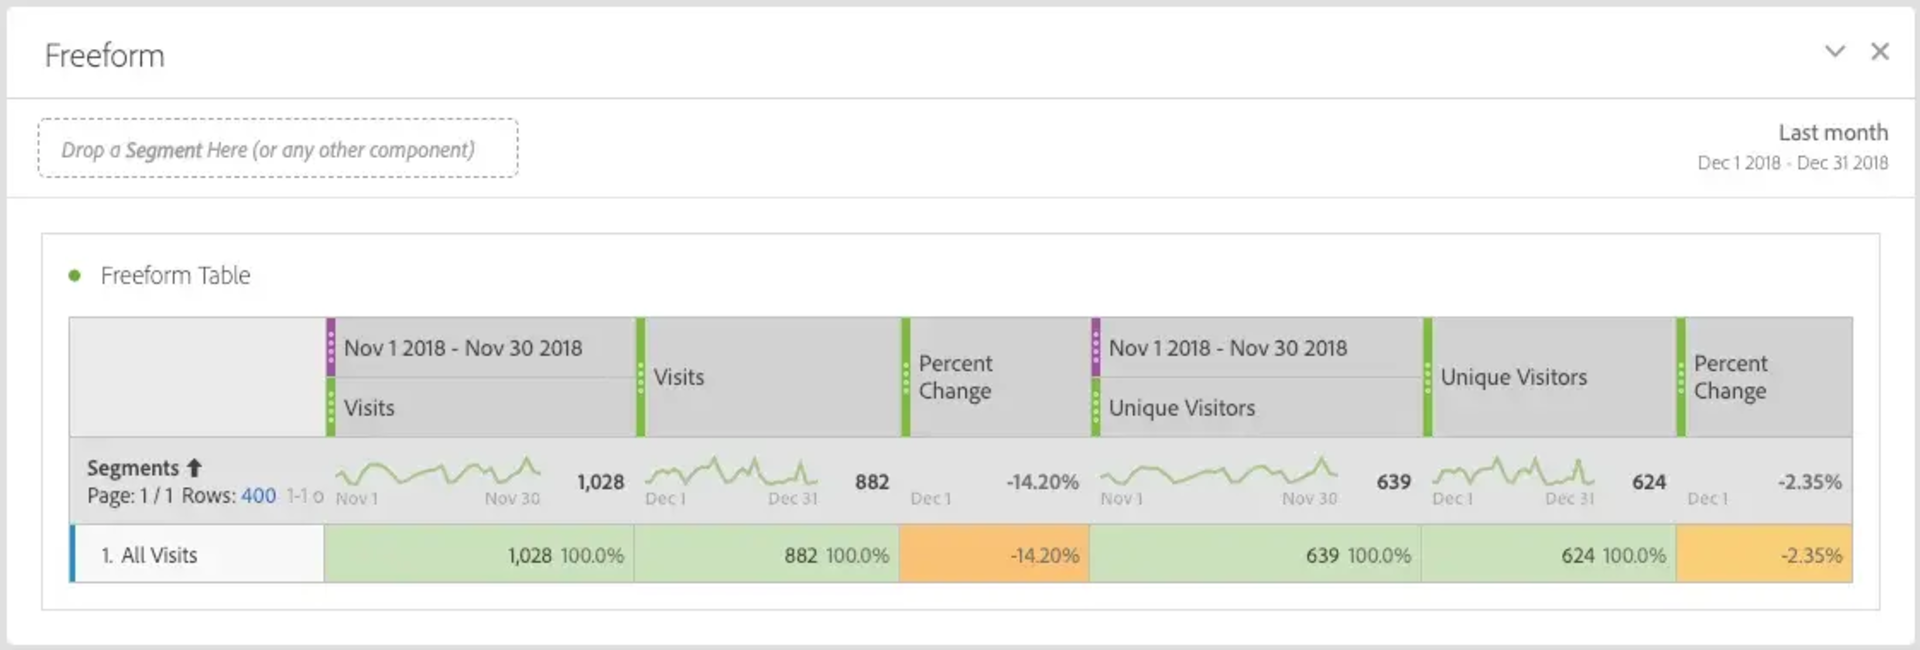
Now go ahead and right click on your metric, choose “compare time period” and then select "custom date range". Look for the date range you just created under the “Select a Preset” dropdown, and select this one. And that’s it! (Keep in mind that you can't select "compare time period" when you dimension is time based as well. A quick solution that I often use, it taking "All visits" as dimension instead.)
Now, every month your workspace "date range" will show the previous month, and the percentage change will look at the change between that month and the month before.
The reason why we didn’t give the custom date range a name is simply because the date will change every month. You could just call this “2 months ago” or give it another name. But when no name is given, the name of the time period will be the end and start date of the actual period. This gives a clear view of which date ranges exactly are being compared.
Now you know.
If you have any further questions, or you would like to know more about Adobe Analytics, let us know or take a look at our next training! We would love to hear your opinion.